
Product Release Notes
We’ve been busy over the last little while fine-tuning the user experience to deliver:
- Redesigned Activity logs to make it easier to track the occurrence of an event and view the corresponding event details.
- Enhanced visibility into the data collection process, giving customers near real time assurance of data source and policy posture.
Our goal is to create a user experience that makes it easy to find what you need, saves you time (and money) and, dare we say, is enjoyable.
Enhanced Activity Log
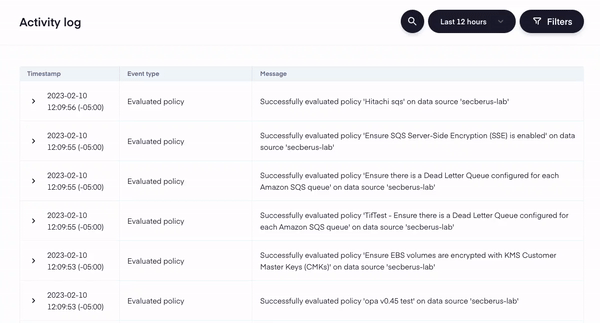
What we did: The Secberus Activity log provides insights into the activity data of your organization.
For all users with the Account owner role, it will now be easier to track the occurrence of an event and view the corresponding event details. Event details include information to help track user activity, monitor policy modifications and coverage, and troubleshoot data source connection issues.
In addition, we’ve added new filtering capabilities by keyword search and date range.
Why it matters to you: You can find the activity log information you need in a more organized and timely manner, meaning you get time back into your day. And you get to deliver key security insights and information to the business faster which keeps the business moving forward.
Enhanced Visibility into the Data Collection Process
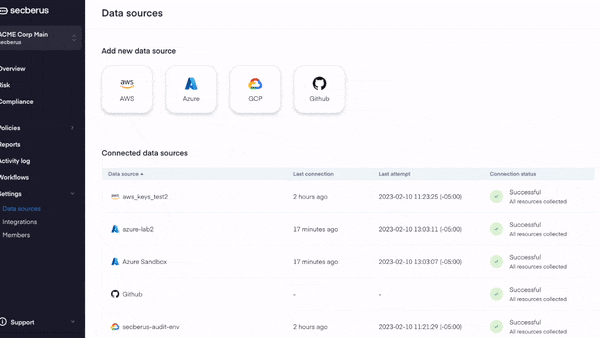
What we did: Secberus built additional visibility into the connection status for monitored AWS, Azure and GCP data sources. Data sources will show one of the following connection statuses:
- Successful: Secberus has collected all resource data required to evaluate enabled policies.
- Partial success: Secberus was able to collect some, but not all of the required resource data. (Note: if you click into the data source, you can see which resources were successful and which failed.)
- Unable to connect: Secberus is unable to connect to this data source.
- N/A: A data source will be in this state immediately after creation while the initial data collection is underway.
Why it matters to you: Now you can:
- Manually initiate the scan of a data source.
- Initiate the execution of a policy for any connected data source.
- Troubleshoot data source connection issues and failed policies with one click.
Essentially, you now have the power to know your data sources are connected and being monitored in near real time.
Robust Policy Coverage Visibility
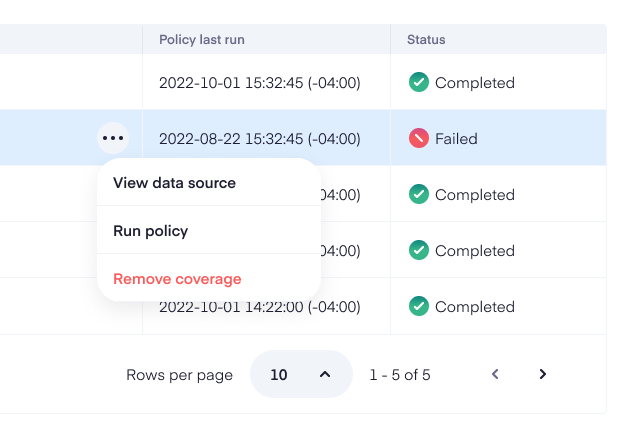
What we did: In addition to enhancing data source visibility, you now have enhanced policy visibility too. For each policy you can view the last time the policy was run, as well as the status on whether the policy execution was successful.
If a policy fails, users can view the collection information for the associated data source to investigate further.
Why it matters to you: Now you can view the execution status of any policy. This additional context will make it easier to verify if the steps you’ve taken to resolve policy violations were effective. Policies will run automatically after detecting resource changes, or you have the option to manually run the policy. The last run timestamp will confirm that you’re seeing the most up-to-date violations. You decide what’s best for the situation you’re in. The point is Secberus wants to help you do your job effectively, efficiently and continuously.
See our previous release here.
Get up-to-date news and updates on what’s happening at Secberus. Follow us on Linkedin or Twitter.
